


- three.js
- Web Workers
- Python
Aetrova · SouthWatch
Mission control for the Moon's south pole, computed from real NASA terrain.
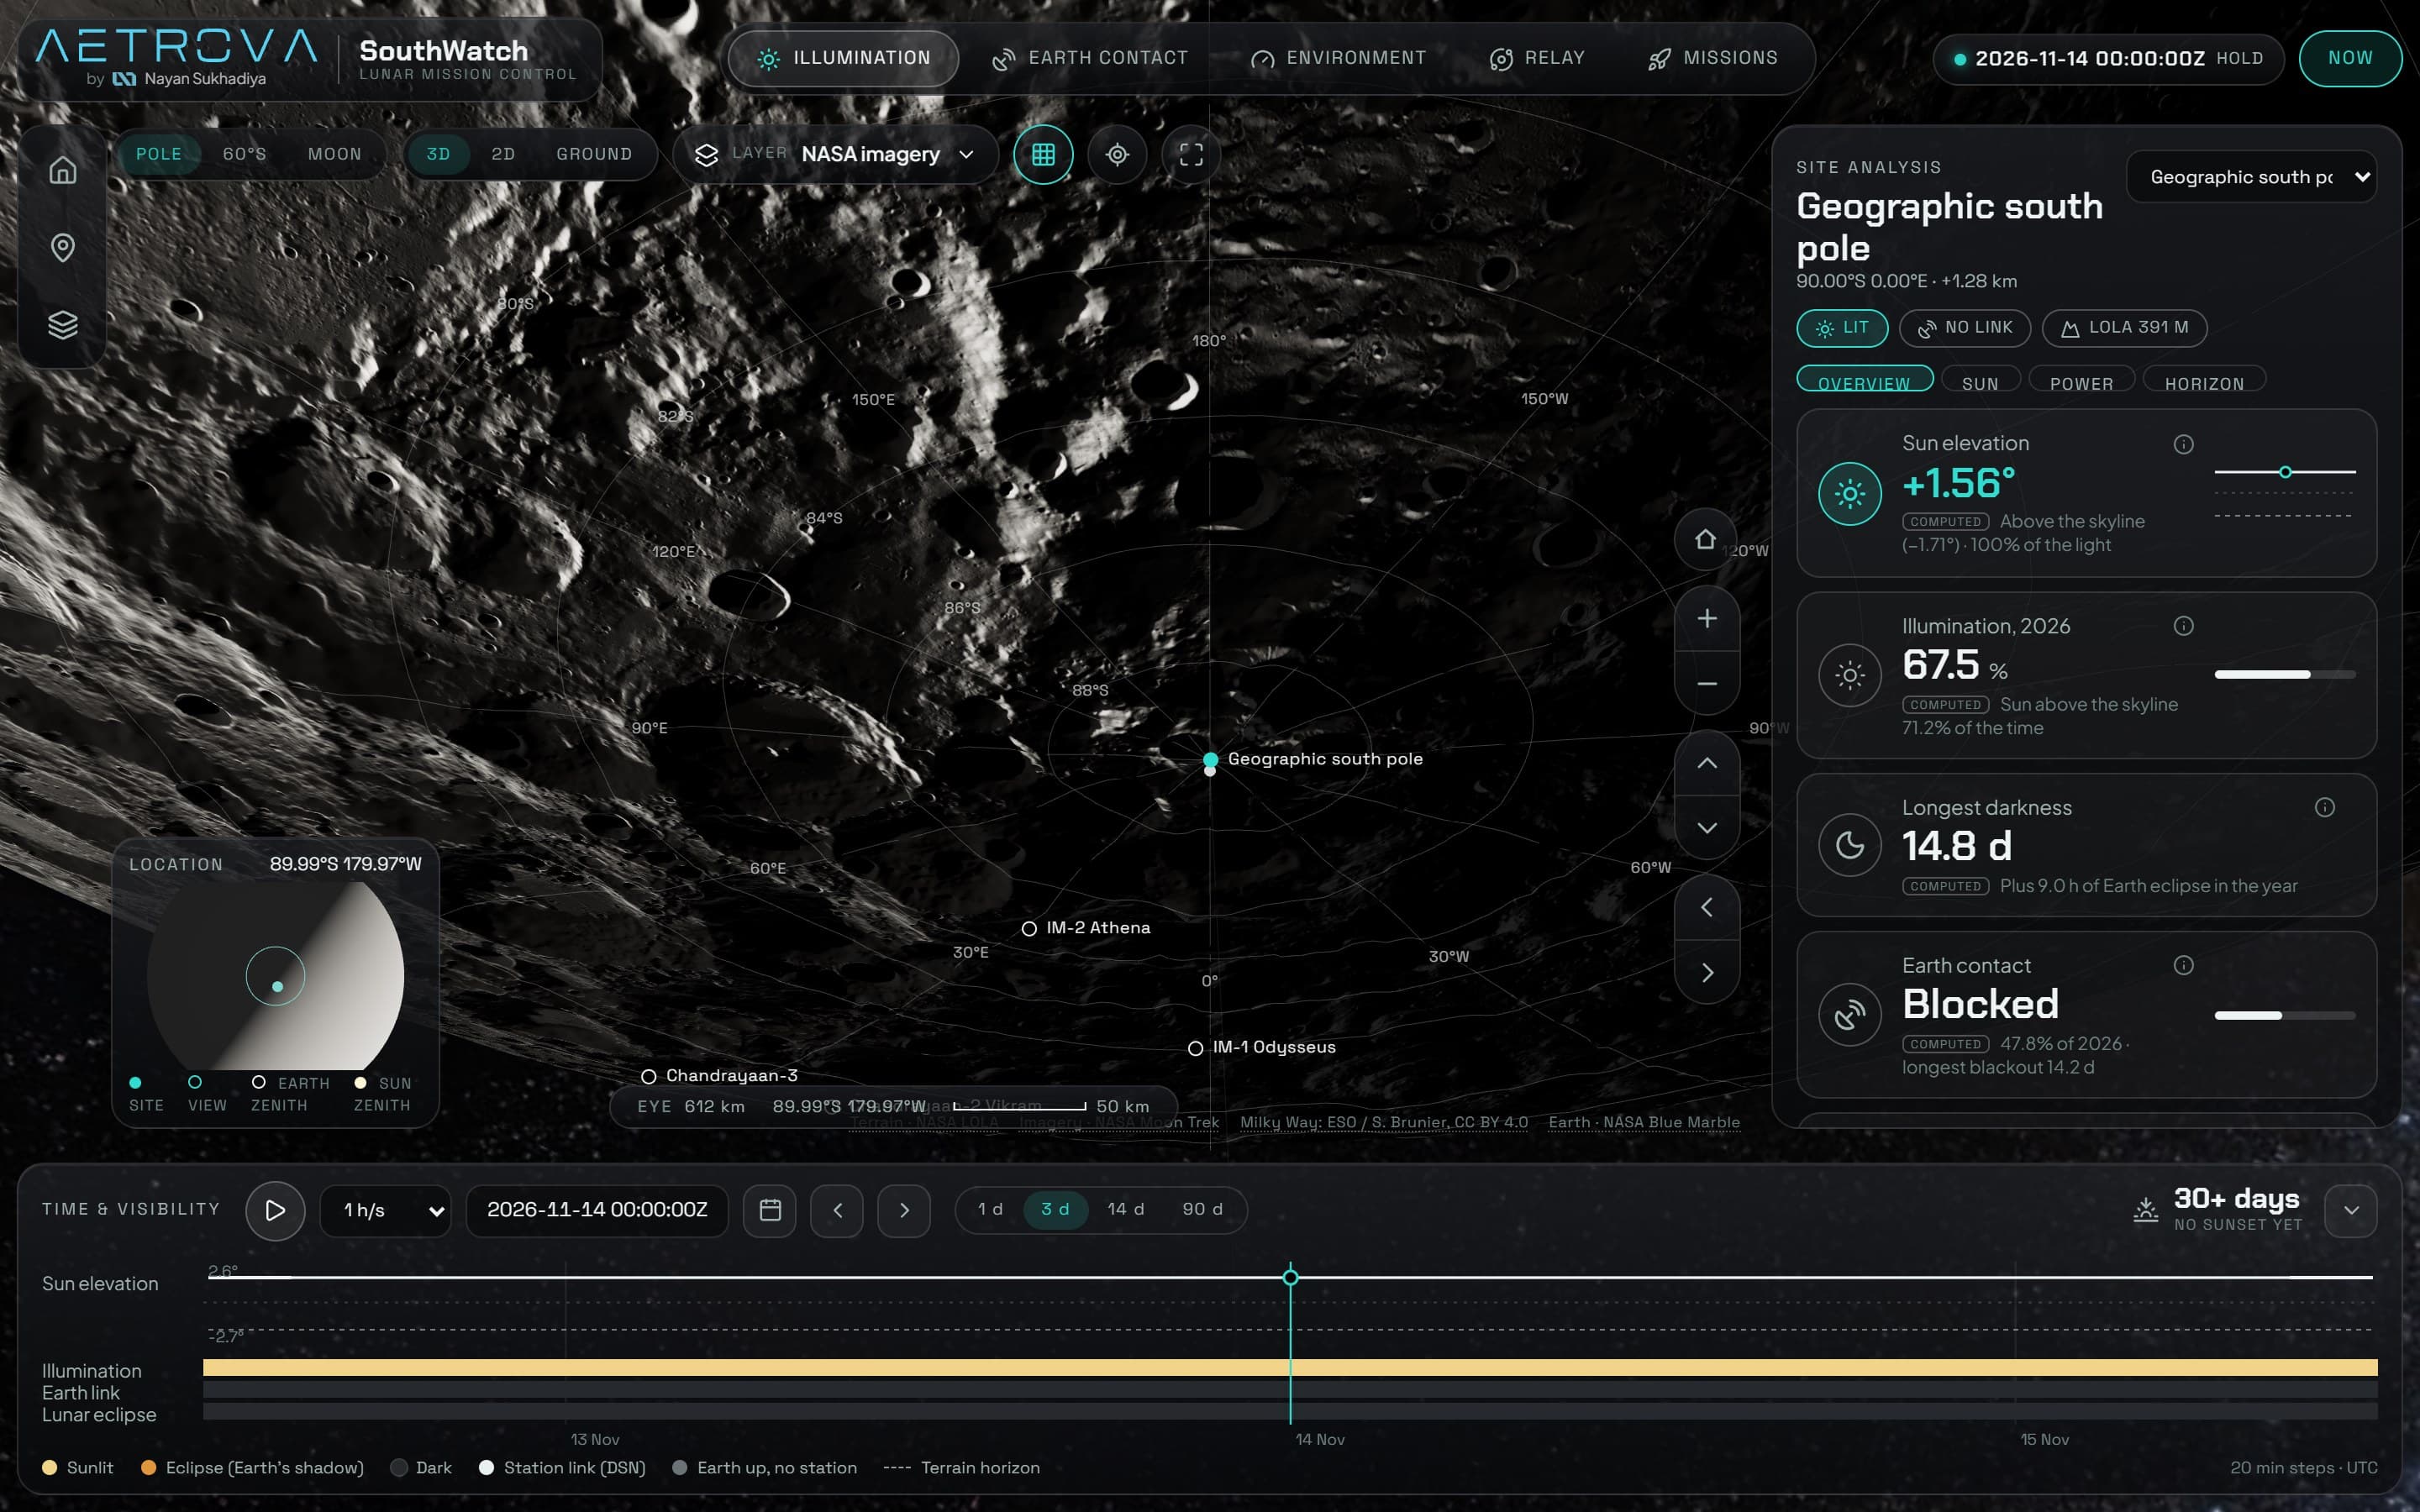
SouthWatch answers a landing planner's question: at this spot near the lunar south pole, when is there sunlight, when can you talk to Earth, and how sure are we? Real LOLA elevation, NASA Moon Trek imagery and orbital maths run live in the browser, and every number is tagged measured, computed or modeled.
What I did
- Brand
- UI design
- 3D + physics
- Data pipeline
0.25°
horizon-mask resolution, finer than the Sun's disk
39
real NASA Moon Trek data layers
108
automated tests on the physics
01
Why I built it
At the Moon's pole the Sun skims the horizon, so terrain, not latitude, decides whether a site has power and a line to Earth. Space trackers show what's around the Moon; SouthWatch shows whether one spot works, when, and how sure we are. My rule for it: 5% real accuracy beats 100% fake accuracy.
02
The problem
- Sunlight at a polar site depends on crater rims and massifs tens of kilometres away.
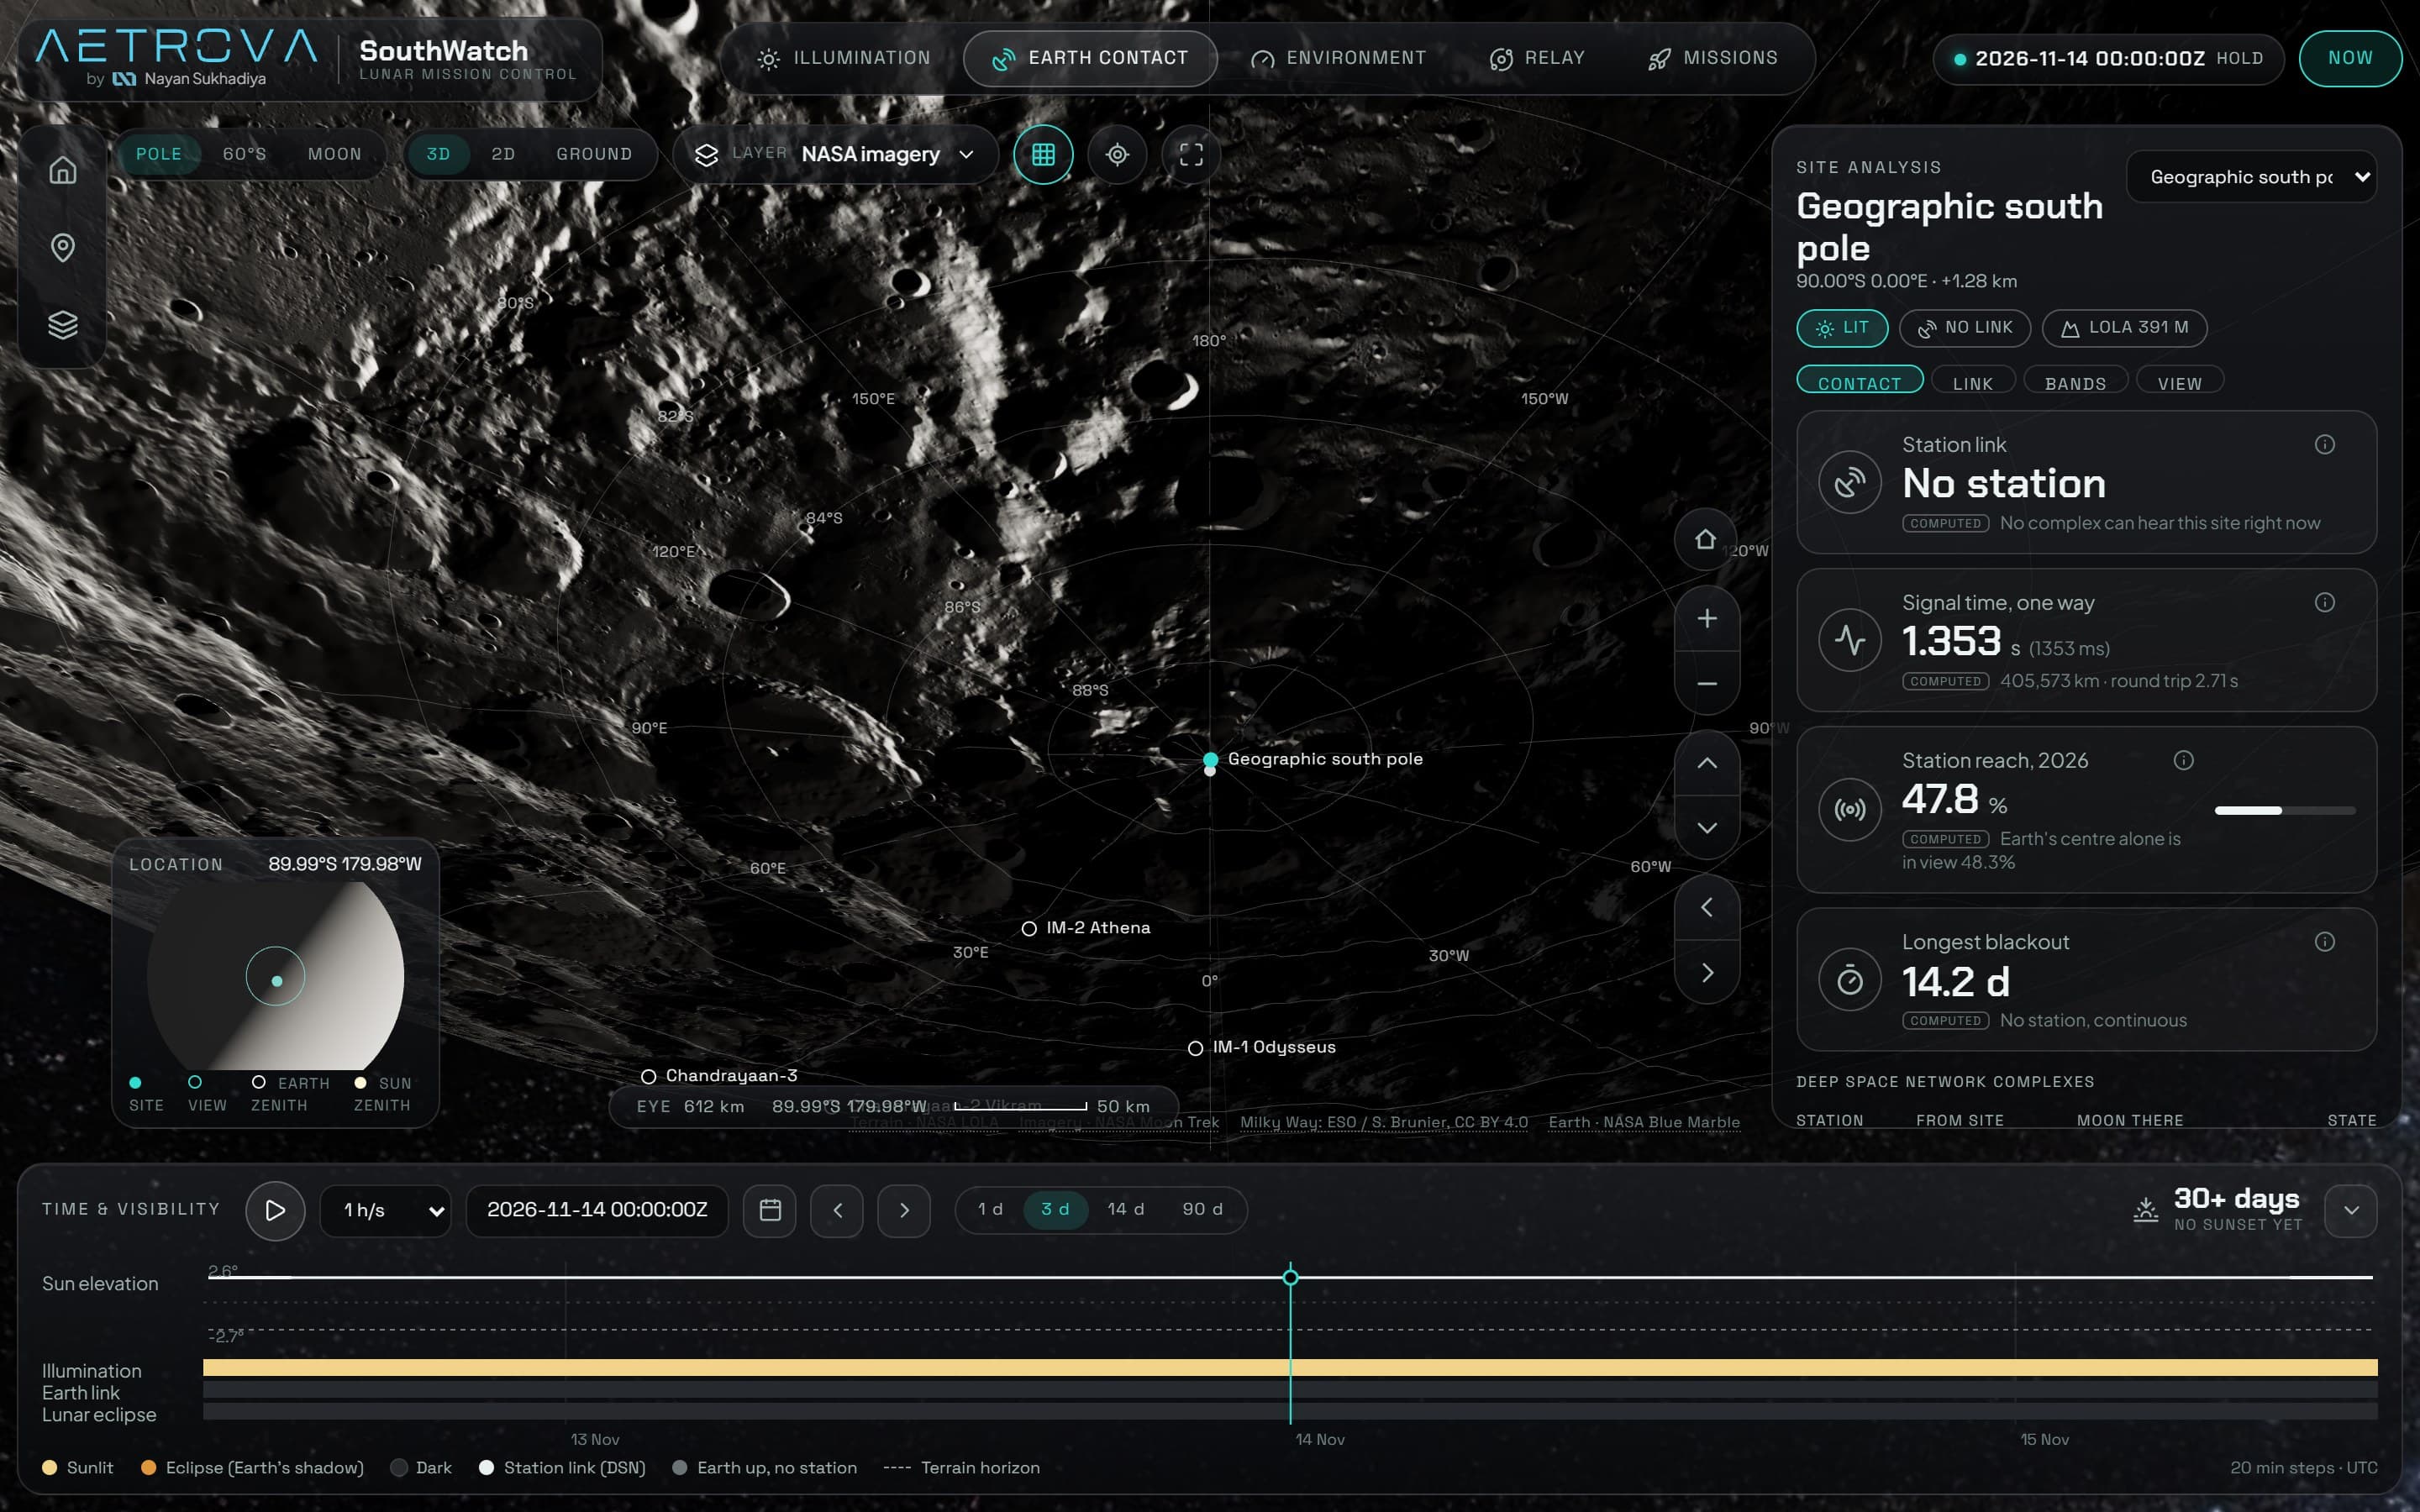
- Earth contact depends on libration and on which ground station can see the Moon, not on Earth's centre.
- The raw elevation data is gigabytes, far too big for a browser.
- Scrubbing through time has to answer within one frame.
03
System design
- 1
Offline Python pipeline
NASA LOLA elevation (80°S at 80 m, 60°S at 120 m, plus the global model) becomes small Float32 heightmaps and horizon masks sampled every 0.25°.
- 2
Astronomy in the browser
astronomy-engine gives Sun, Earth and Moon positions; a frame chain turns them into elevation and azimuth on the local horizon of the chosen site.
- 3
Physics layer
The Sun as a limb-darkened disk, eclipses by Earth's shadow, NASA Deep Space Network stations with a 10° keep-out, and live signal light time.
- 4
Web Worker
Year-long illumination and Earth-contact sweeps run off the main thread, so the time scrubber never drops frames.
- 5
three.js scene
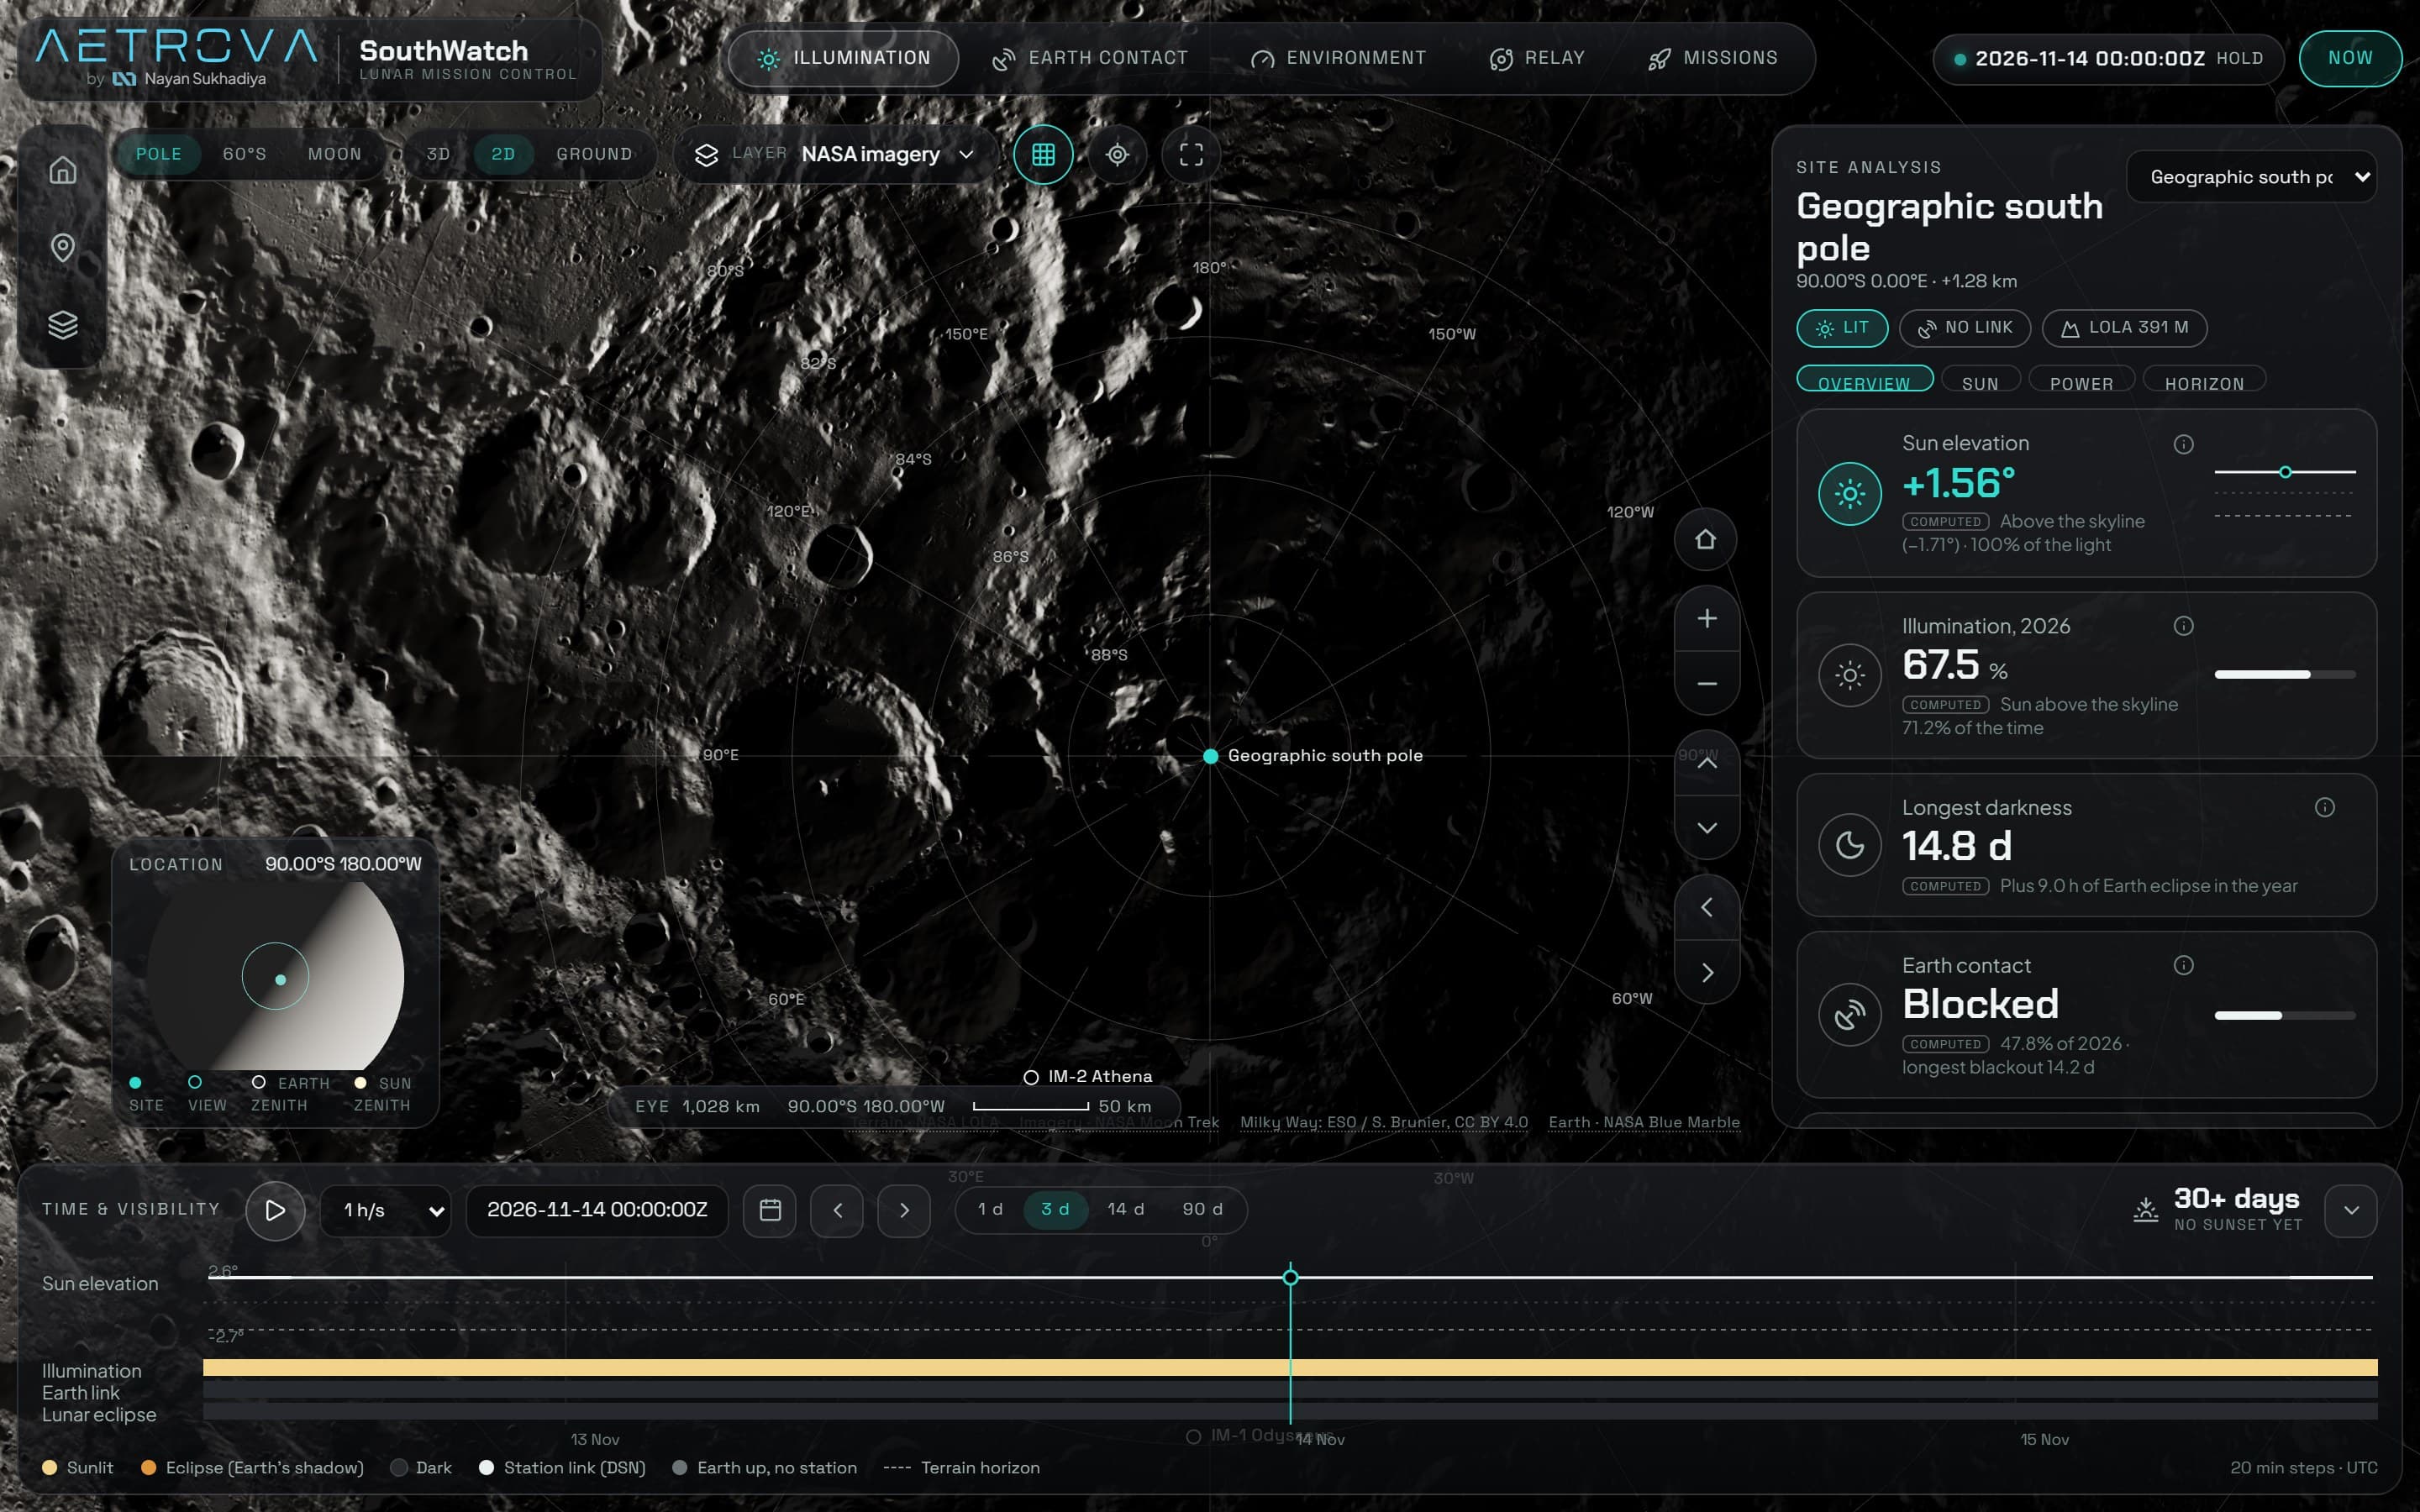
Real terrain draped with NASA Moon Trek imagery: pole, 60°S and whole-Moon views in 3D, 2D and from the ground.
04
Decisions & trade-offs
Stress-test the physics before writing it
Why: I reviewed the plan from a physics angle and a mission-operations angle and logged 25 gaps, 6 of them critical (horizon reach, azimuth resolution, ground stations vs Earth's centre, eclipses, validation pairing, a region vs a point). They were fixed in the formulas first.
Trade-off: Weeks of preparation before any feature work.
Heavy terrain work offline, time-dependent maths in the browser
Why: What never changes is computed once in Python; anything tied to the time slider runs live, so scrubbing answers within one frame.
Trade-off: A data pipeline to maintain alongside the app.
No server at all
Why: A static app can't go down during judging, and there's no user data to store.
Trade-off: Click-anywhere horizon calculations are limited to what the browser can do.
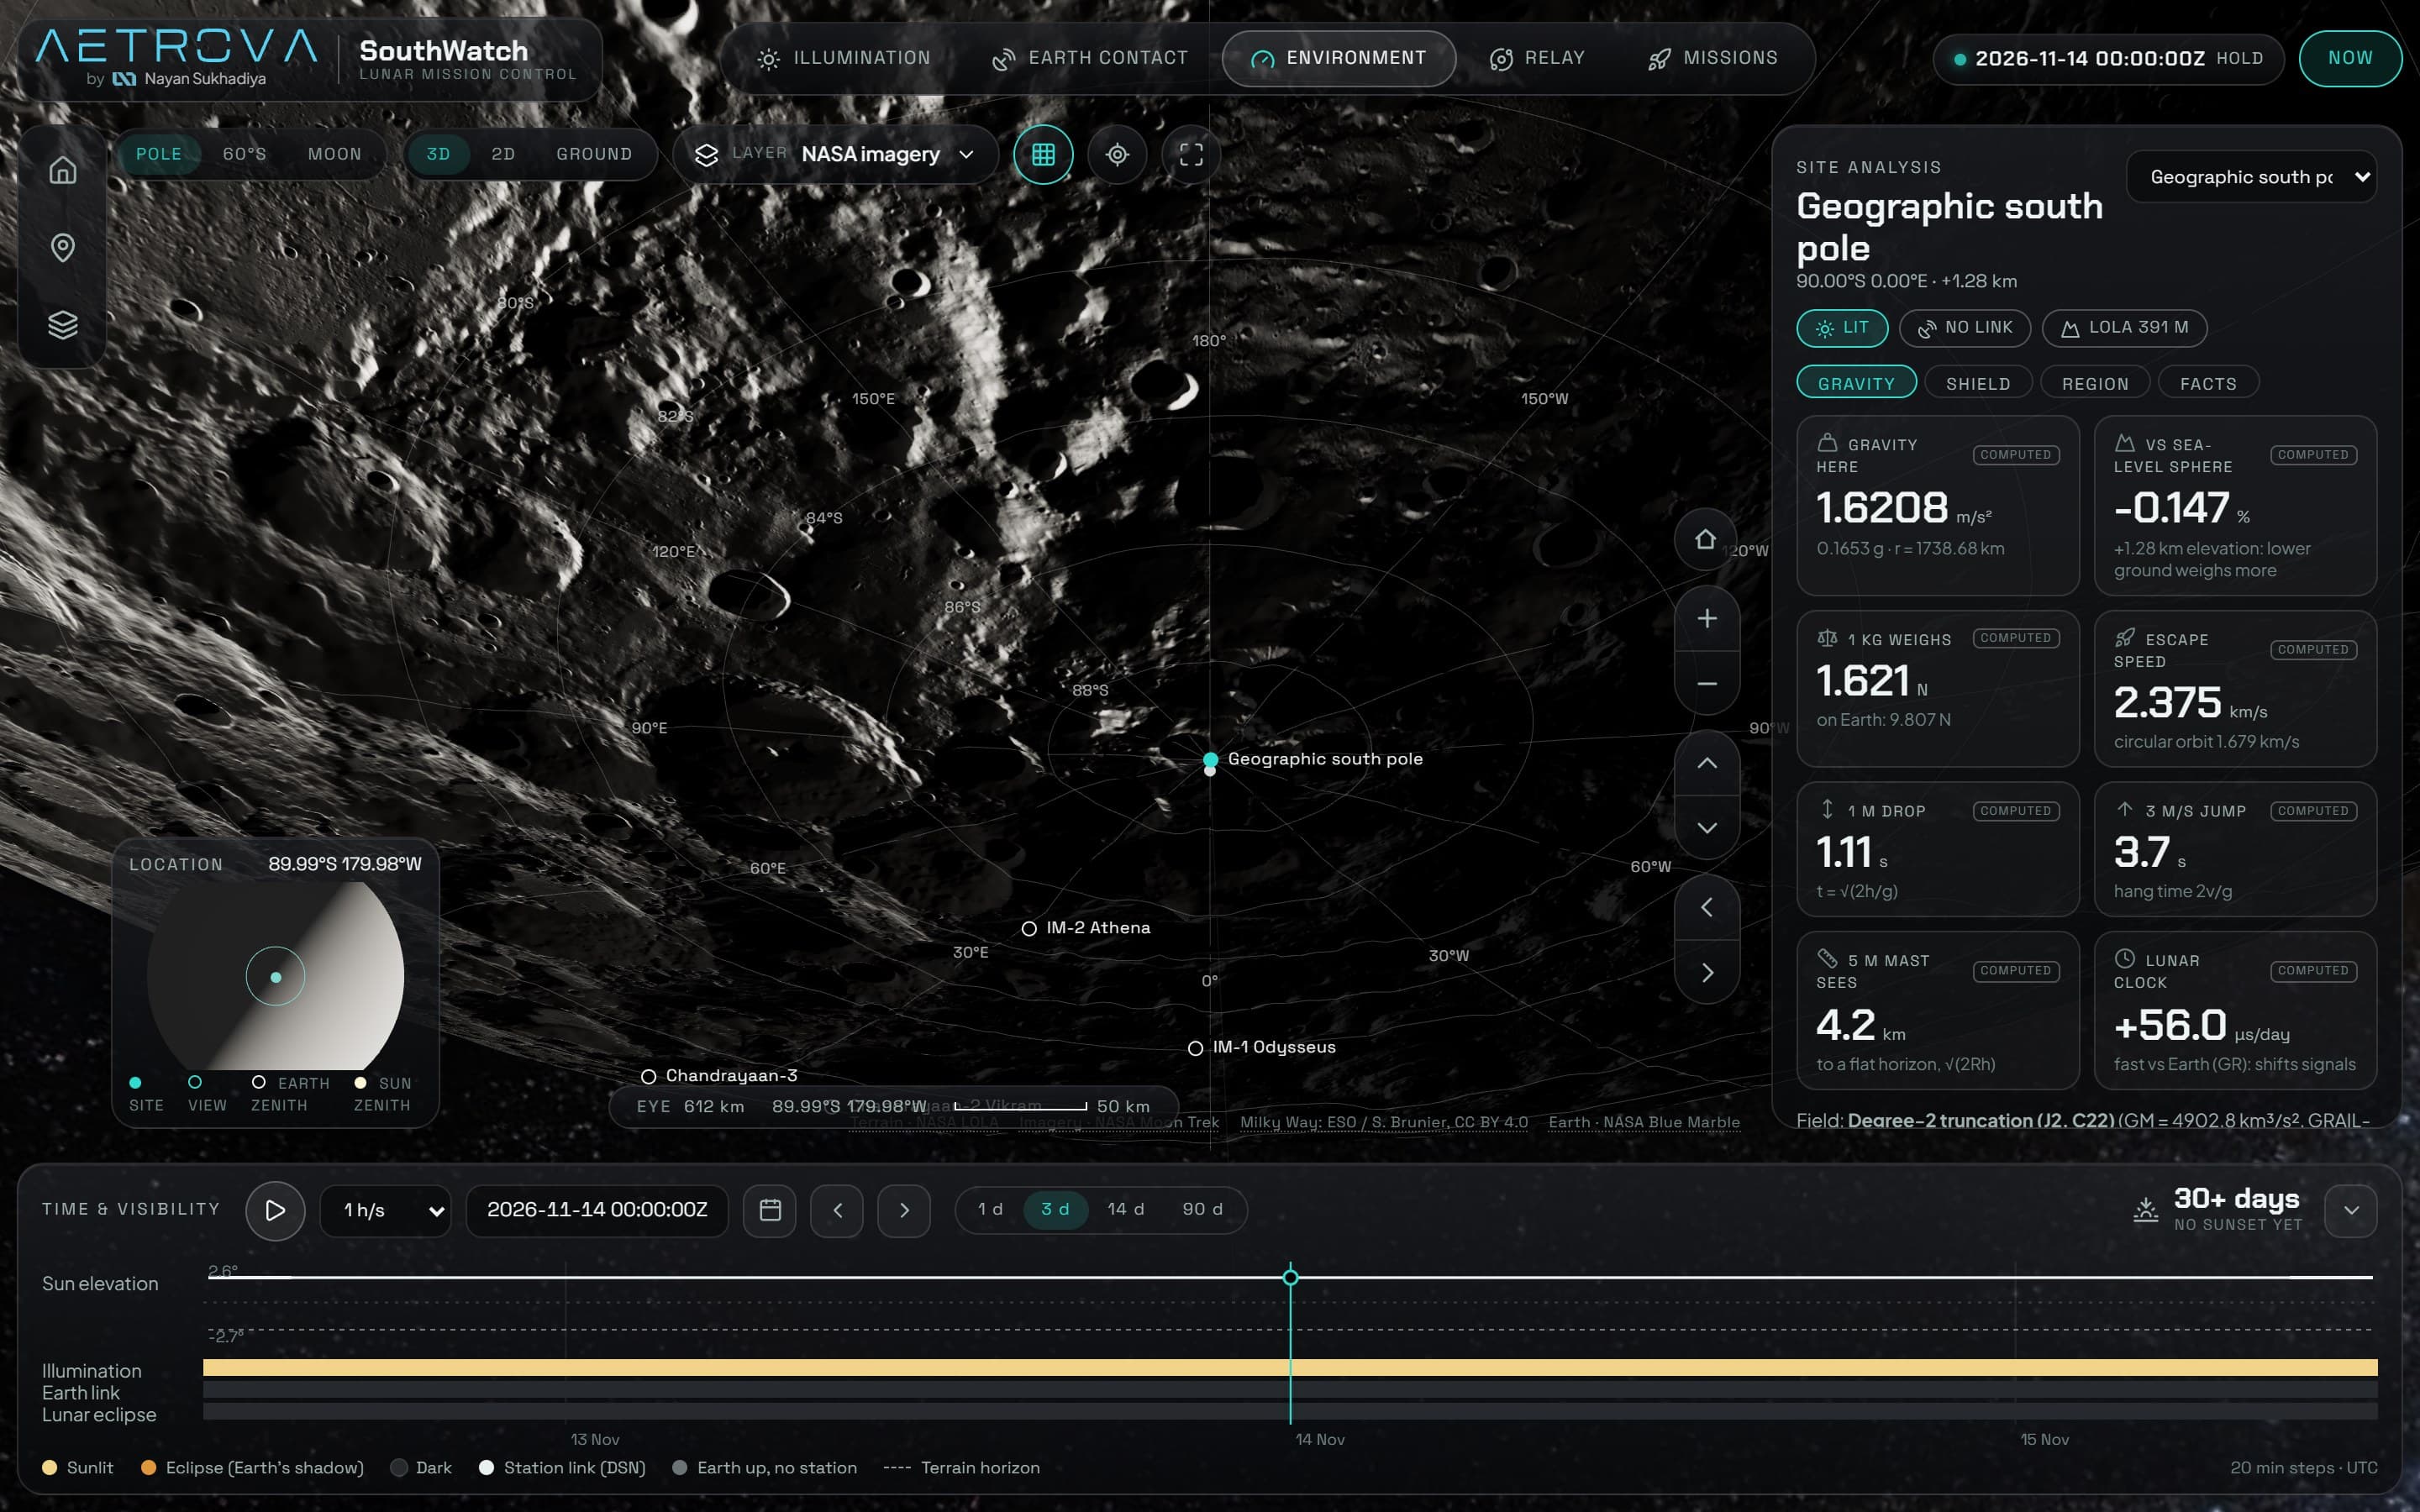
Every number carries a MEASURED / COMPUTED / MODELED tag
Why: A planner can see exactly how much to trust each value, and every source is credited on screen.
Trade-off: More UI, and some values shown with honest caveats instead of false precision.
05
Backend & frontend
Backend
- No live server: a static app plus an offline Python pipeline that turns gigabytes of LOLA elevation into small binary files.
- 39 NASA Moon Trek layers catalogued from a live probe of the service.
Frontend
- Mission-control dashboard: one site-analysis panel, icon tabs (Illumination, Earth Contact, Environment, Relay, Missions) and a time-and-visibility dock.
- Sun elevation against the terrain horizon, with sunlit, eclipse and Earth-link bands over 1 to 90 days.
- Chandrayaan-3 replay at its real site, click-to-probe and shareable URL state.
06
Design
- Aetrova wordmark and a black-glass interface with one teal accent reserved for state.
- Each value has an icon, a trust tag and an info tooltip, so every simulation explains itself.
07
Results
- Built and running: real terrain, 39 NASA data layers, Sun, Earth, eclipse and ground-station physics, 108 tests passing.
- Entering NASA Space Apps Challenge 2026 (14–15 November).
What's next
- Golden tests against NASA SPICE reference values.
- Validation against NASA's published illumination maps.